electionblog
Blog Post 11/23/2020: Reflecting on my PredictionsIt has been nearly three weeks since election day and over two weeks since most major media outlets called the election for now President-elect Joe Biden. Thus, this week, I will reflect on my model’s forecast. While I did call that Joe Biden will win the 2020 presidential election, it is important to recap and judge my model’s accuracy. In addition to judging the model’s accuracy, I will come up with hypotheses for my model’s inaccuracies and propose tests to evaluate them. As an aside, thank you for following the blog throughout the semester.
Part 1: Recap of My Model's ForecastFirst, I want to provide a recap of my model and its forecast. Due to the unusual economic conditions caused by the COVID-19 pandemic, I used a polls-only model. I only used state-level polls that ended on or after October 20th, 2020, which was two weeks before election day. This was done in hope of catching any late shifts, such as the one President Trump enjoyed in the final weeks of the 2016 campaign. Furthermore, I weighed all polls with a FiveThirtyEight grade of C- or less at 0%, including only polls with a C rating or above. Thus, my model was entirely dependent on quality polling in the final two weeks of the voting period.
Unfortunately, my inclusion of only quality state-level polls that ended on or after two weeks before election day left me with just 230 polls, and these 230 polls did not cover some states. I deemed these states safe states, as they have a reliable history of voting for either the Democratic or Republican party consistently in the past 3 decades. Below is my final prediction:
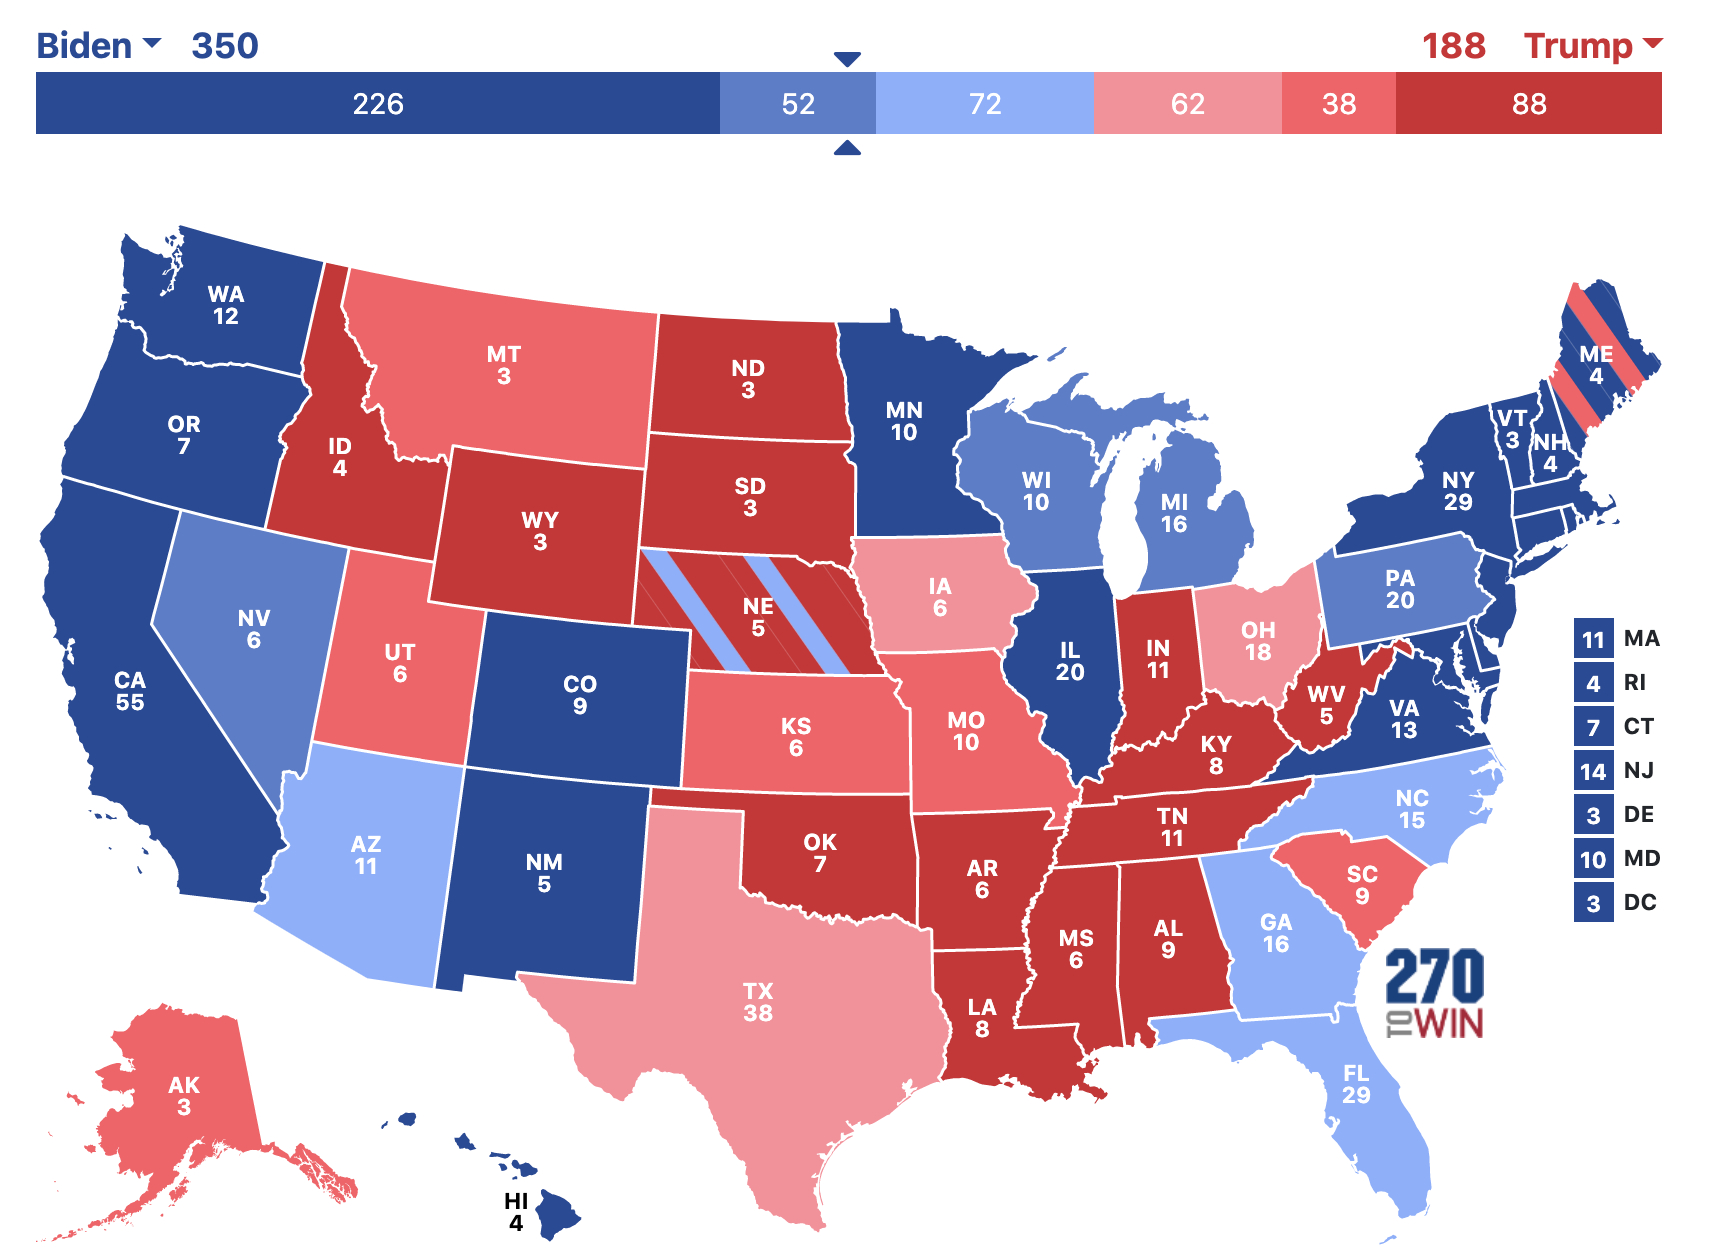
I also forecasted the popular vote in the states I had the data of, represented as forecasted GOP margin. These margins are visible below. Among swing states, I ultimately forecasted Iowa, Ohio, Texas, and Montana for Donald Trump and Georgia, Arizona, North Carolina, Florida, Pennsylvania, Nevada, Wisconsin, and Michigan for Joe Biden. I did note, however, that the average error of polls in the final 21 days of general elections is 4.0%, so many of my close calls could easily go the other way [1].
Overall, I was satisfied with my model’s accuracy. I called every state except for Florida and North Carolina, which voted for Donald Trump. I am most proud of forecasting Arizona and Georgia to flip blue, as Arizona has not been won by a Democratic candidate since 1996 and Georgia not since 1992 [2]. However, just calling 48 out of 50 states is not enough to deem it a great model. Consequently, I investigate my forecasted GOP margins versus the actual results in Part 2.
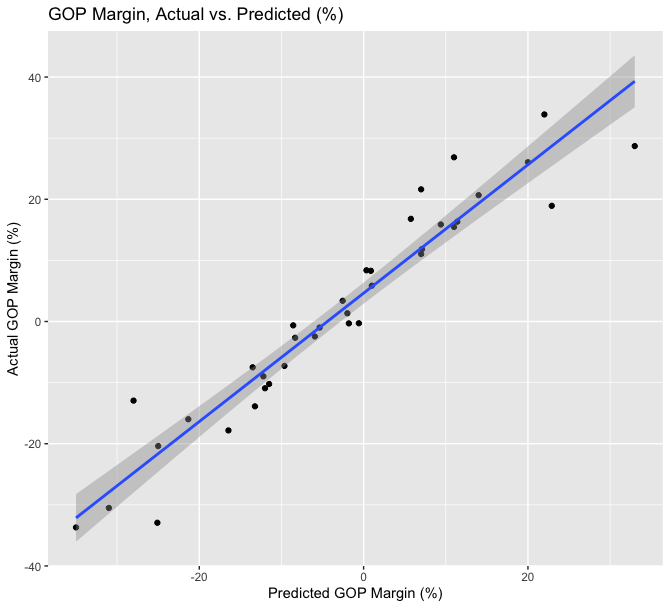
First, I graphed the actual GOP margin versus my model’s forecasted GOP margin. This graph demonstrates the 37 states that my model could forecast, as the other 13 were safe states that did not have high quality polling in the last two weeks of the election period. Nevertheless, the line of best fit is nearly a perfect diagonal. The slope’s coefficient in the linear model is 1.0507, indicating that President Trump’s margins are 5.07% better than I had forecasted. The multiple R-squared was a high 91.65%, which I am quite satisfied with as well. The visualization, below, brings about an interesting pattern in my model: in states that I predicted Trump to lose (where the x-axis is less than zero), there are more states under the line of best fit than above it, and in states that I predicted Trump to win (where the x-axis is greater than zero), there are more states above the line of best fit. Thus, it seems that my model underestimated Joe Biden in Democratic states and underestimated Donald Trump in Republican states.
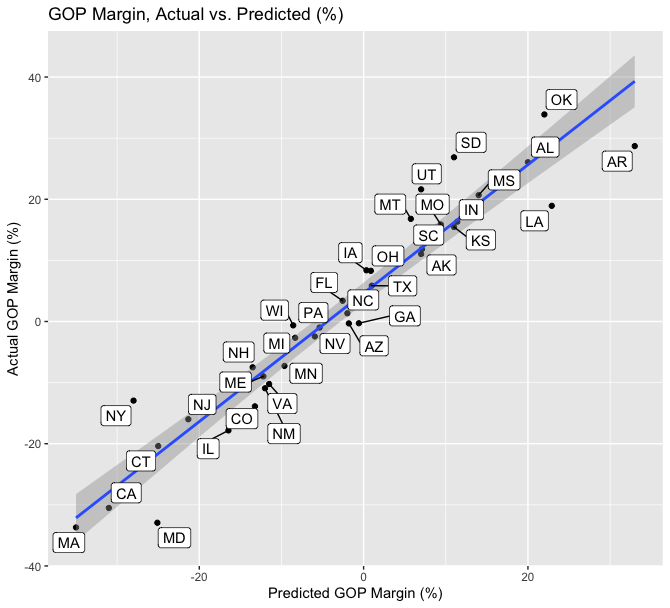
I also created the same graph but with labels for each state forecasted by my model, below.
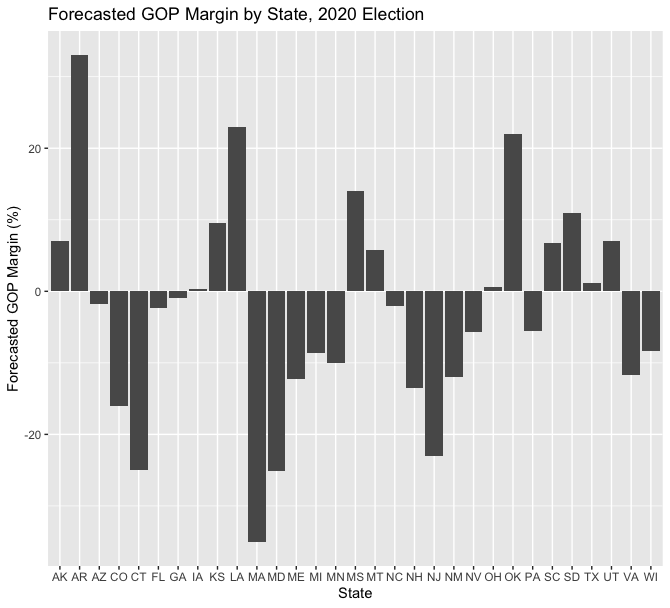
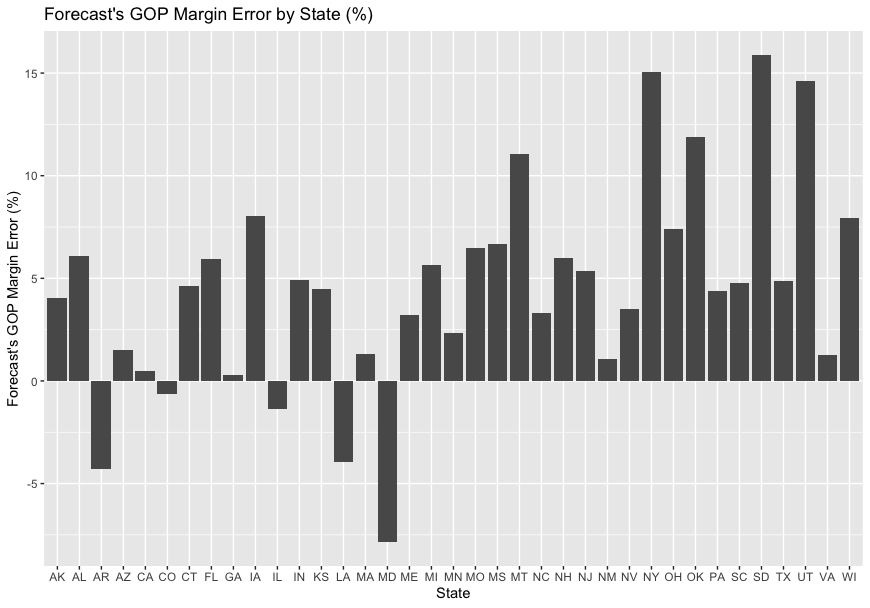
While this visual and linear model analysis demonstrates that my model was quite solid at predicting the GOP margin, I wanted to analyze it from a different visual perspective to see if there were any systemic biases. Thus, I created a bar graph of the my model’s error, subtracting my predicted margin from the actual margin. As such, positive numbers indicate that my model underestimated Donald Trump’s margin, while negative numbers indicate that I underestimated Joe Biden’s margin. The bar graph, below, demonstrates a huge disparity: the model only underestimated Biden’s support in 5 states (AR, CO, IL, LA, and MD), while I underestimated Trump’s support in 32 states. However, this analysis must be ran at a future date when the vote tallying is finalized, as some states have not finished counting at the time of this reflection. For example, one of the highest errors in this bar graph is for New York, which has been so slow at counting that New York Democratic Deputy Majority Leader Senator Michael Gianaris stated “if we were a swing state in this presidential election, this would be a national scandal”[3]. Despite a few states having delays in counting, though, it is clear that my model systematically underestimated Donald Trump’s margins.
Why was my model consistently underestimate Donald Trump’s margins? I have considered this question over the past few weeks, and have ended up with a few hypotheses:
1. The polling industry is getting worse at its ability to gather representative samples.
My model only uses state-level polls, and as mentioned above, overall underestimated Trump’s support. However, I’ve noted that there is a pattern of my model underestimating Biden in blue states and Trump in red states. I hypothesize that due to societal changes, it is more difficult for pollsters to gain a representative sample. First, the methodologies for gaining responses is changing very fast. Pollsters have to choose between calling home phones, which many people may no longer have, online polls, cell phone calling, and a multitude of other options. In today’s 24-7 world and the constant use of technology, it may just be more difficult for pollsters to get people to answer questions for 15 minutes.
2. Increasing polarization in the United States is causing partisan non-response, causing polling errors and red states to become more red and blue states to become more blue.
Another hypothesis is that the increasing polarization of the United States is causing red states to become more Republican and blue states to become more Democratic. This polarization may have led to partisan non-response to pollsters among Republicans, which could potentially explain the polling errors, summarized by Nate Silver as “underestimating President Trump by what will likely end up being 3 to 4 percentage points in national and swing state polls”[4]. Furthermore, the shy-Trump voter theory may be true; maybe Trump voters do not respond truthfully to pollsters. Election analyst and former class guest David Shor recently stated that “liberals just started taking surveys at really high rates” and that partisan non-response affected poll accuracy [5].
Part 4: Proposing Tests to Test HypothesesTo test Hypothesis 1, I would need data on the polling errors per state by polling method. Running a regression for each polling method per each individual state would allow me to see if there is a systemic error in either a polling method or in a polling region. Unfortunately, gathering this data would likely not provide a clear path to improving polls, as there are likely various errors in each methodology and in different regions of the country. I could also run an analysis on how polling error relates to the percentage of people who respond to polls, as increasingly small response rates may signal lesser representativeness of polls.
Testing the partison non-response portion of Hypothesis 2 is not plausible. One would need to gather a representative sample of people who answered polls and ended up voting, and would then have to question them over whether their polling answers and actual vote matched up. Unfortunately, this method would be subject to the error itself, as those who were untruthful to pollsters may be untruthful again. To test the polarization portion of hypothesis two, polling would need to be done on a state by state basis and ask if people have become more Democratic or more Republican over time, which would be subject to many erorrs, such as defining more Democratic or more Republican and gaining samples that roughly align in age.
Part 5: If I Were To Do It AgainIf I were to run the model again, I would likely use very similar methods. The unique economic conditions and the COVID-19 pandemic still make including fundamentals feel uncomfortable. I would, however, use polls from up to 4 weeks out instead of just 2 weeks. The 2020 election had very high vote-by-mail voting, and thus, millions had voted before my poll-end-date cutoff. I would weigh the polls from 2-4 weeks out less than those of the final two weeks. My model would be improved with more polls, as just 230 polls may not have been enough. If I were to create a model for the 2024 election, I would use economic fundamentals, as I believe just using polls is not enough. However, due to the extremely unusual circumstances of the 2020 election, I believe I made the right choice in creating a polls-only model and am satisfied with predicting 48 out of 50 states.
Thank you so much for readinng along throughout the semester!
Sources[1] https://fivethirtyeight.com/features/the-polls-are-all-right/
[2] https://www.usatoday.com/story/news/nation/2020/10/12/2020-election-biden-win-arizona-texas-and-georgia/5902421002/
[3] https://www.cnn.com/2020/11/18/politics/new-york-california-election-delay/index.html
[4] https://fivethirtyeight.com/features/the-polls-werent-great-but-thats-pretty-normal/
[5] https://www.vox.com/policy-and-politics/2020/11/10/21551766/election-polls-results-wrong-david-shor