electionblog
Blog Post 11/1/2020: 2020 Election Final PredictionsIt is time for my final prediction for the 2020 election! Read along to see my methodology in Part 1, the model’s state-level predictions in Part 2, and evaluations and Electoral College predictions in Part 3.
Part 1: MethodologyIn my making my model, I decided to take a different approach and use only polling data. There are several reasons for this decision: first, the U.S. economy went through its worst quarter ever, with GDP declining 32.9% [1]. Including such a poor economic quarter into my model could have an exaggerated projection against the incumbent. Previous models focused on economic fundamentals have election year second quarter drops that are much smaller than that of Q2 2020. I ran into such issues previously in this blog, where including the economy’s performance this year would virtually eliminate President Donald Trump’s chances at re-election. As Trump is currently at 45.5% in FiveThirtyEight’s polling average, it is clear that he has a non-zero chance [2]. After deciding against using fundamentals on the economy in my model due to a potential anti-Trump bias in my projections, I considered other variables that may be unique to 2020 and are best left unincluded. The COVID-19 pandemic has resulted in the 2020 election being distinct from previous United States presidential elections, as states’ allowing or expansion of early voting and vote by mail has led to a record number of early votes cast [3]. Consequently, I do not project voter turnout. Rather, my model is a polls-only model.
My model relies on recent polling. I accessed FiveThirtyEight’s data repository on GitHub and downloaded a dataset with all the 2020 presidential election polls included by their team [4]. First, I filtered for only state-level polls because my goal is to predict each state’s likely outcome. Second, I filtered to only include polls that ended on or after October 20th, 2020, which is two weeks before election day. While Biden’s polling average lead has been more stable than Hillary Clinton’s in 2016, it is important to note that there were large shifts toward Trump in the final weeks of polling. In a post-election analysis in December 2016, FiveThirtyEight contributor and University of Pennsylvania political science professor Dan Hopkins discusses an Institute for the Study of Citizens and Politics Panel Survey that captured this shift, stating, “Trump picked up 4.0 percentage points among people who hadn’t been with him in mid-October, and shed just 1.7 percentage points for a net gain of 2.3 points. Clinton picked up a smaller fraction — 2.3 points — and shed 4.0 points for a net loss of 1.7 points” [5]. Thus, my justification for only including polls that ended on or after October 20th is that I want to capture any potential late shifts that other models may miss. This decision changed the number of polls used from 4,674 to 1,366.
Once I had this modified dataset of 1,366 polls, I was conflicted as to how I should weigh the polls. I noticed that the majority of the polls I had in my dataset had a FiveThirtyEight rating of C- or lower. Since 538 has a robust methodology for grading polls on historical accuracy, pollsters’ House effects, and tendencies toward herding, I did not want to use a model with a majority of polls classified as below average [6]. My dataset had many polls by low-rated pollsters such as SurveyMonkey or Trafalgar, which The Economist data journalist and class visitor G. Elliot Morris described as having “the worst house effect in our model, FYI. Estimates have been on average biased 5 points on margin toward Trump” [7]. Comments such as these worried me about the accuracy of my dataset and subsequent projections, and thus, I ultimately decided on a weighting of:
Group 1: “A+”, “A”, “A-“, “B+”, “B”, “B-“, “C+”, “C”, and “B/C” weighted at 100%
Group 2: “C-“, “D+”, “D”, and “D-“ weighted at 0%
The exclusion of all polls that are a C- or lower led me from 1,366 polls to 230 polls. Thus, while this exclusion may seem harsh, it rids me of creating a model in which 83.16% of my polls are from pollsters that have poor 538 grades. After the poorly-performing pollsters were removed, I was conflicted about weighing the remaining polls. While weighing better-performing pollsters higher and worse-performing pollsters lower seemed ideal, I perused through my dataset of 230 polls and noticed a few irregularities that could adversely shift my model’s predictions: 1) there were only 8 polls graded “A” and all of them were from the pollster SurveyUSA, and 2) the 42 polls graded “A-“ all came from just two pollsters, Emerson College and Fox News. I worried that highly weighing such a small number of polls from just one or two polling organizations would cause bias in my model. It would mean increased reliance on individual poll results and polling methodologies when averages tend to provide a more diverse perspective. Essentially, I felt justified in eliminating poor performing polls with a 538 grade of C- or below and weighing all other polls equally because I wanted to avoid herding. A model reliant on a small sample size of just 230 polls could negatively influence polls’ independence by the aforementioned actions such as weighing 8 polls from one pollster too highly.
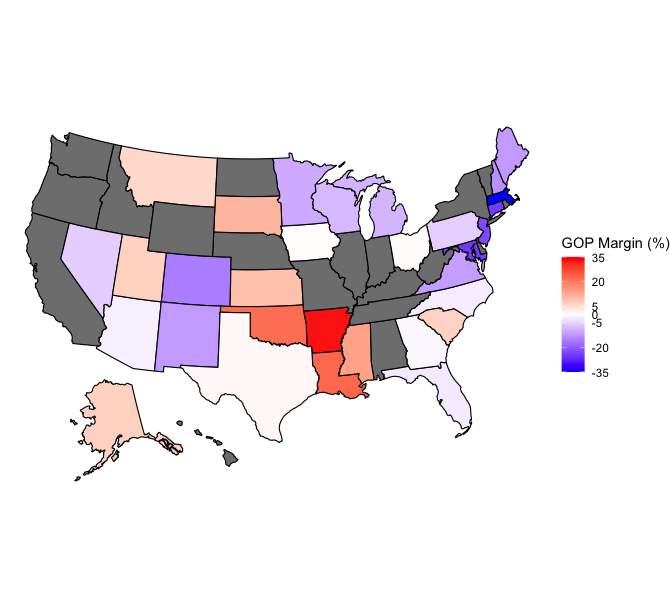
Part 2: What does the model predict?In part 2, I display and explain the results of my model. My dataset did not include state-level data on every state, as pollsters are much too busy to focus on states the campaigns perceive as locks, such as California, Alabama, or New York. The first data visualization, below, shows a United States map of the forecasted GOP margin in states I had data for. The deeper blue a state is, the more likely it is to deliver its Electoral College votes to former Vice President Joe Biden. Conversely, the deeper red a state appears, the more likely it is to vote for President Donald Trump. Many states on this map seem to be filled in white, which signals that it is a very tight race.
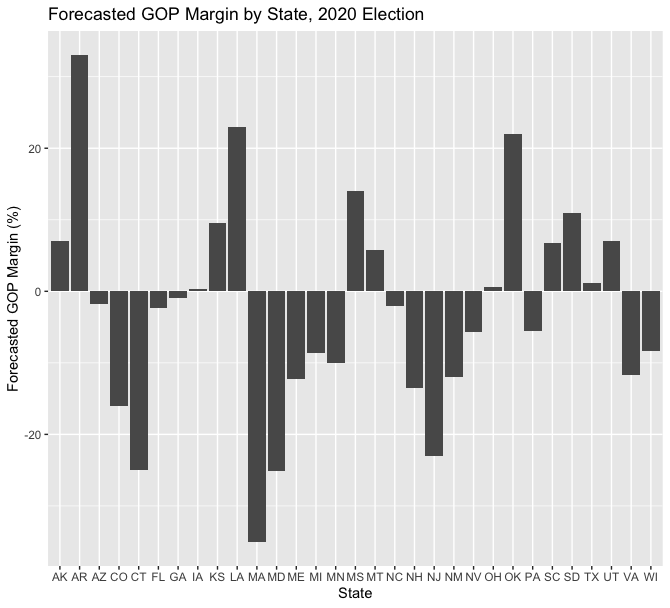
Consequently, I want to provide a clearer perspective of the state of the race. In the visualization below, I graphed the forecasted GOP margin for each state in my dataset. States with a positive number are forecasted to vote for Donald Trump while states with a negative number are forecasted to vote for Joe Biden. It is apparent that my model forecasts close victories in several key states, so I also created a visualization that displays only the states within a ten percent margin in the model’s forecasts.
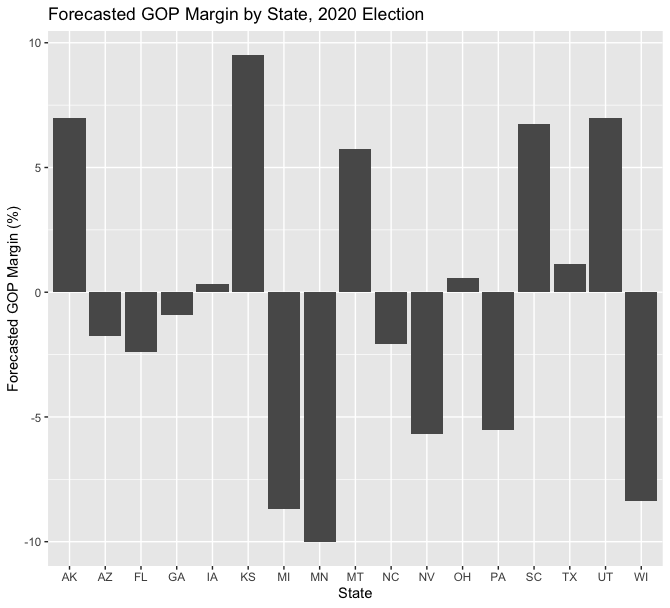
There are 17 states with a forecasted margin of 10% or less. The average error of all polls conducted within the last three weeks of campaigns since 1998 is about 6%, so it is reasonable to assume that the states within a 6% forecasted margin may go for either Trump or Biden [8]. TEN states in my model are within a 6% margin, as is visible below.
Here are the model’s forecasts for these 10 states in order of smallest to largest margin, per candidate:
Trump Small-Margin Forecasted Wins
Iowa: 0.31% winning margin, 47.04 (R) - 46.73 (D)
Ohio: 0.59% winning margin, 47.53 (R) - 46.94 (D)
Texas: 1.12% winning margin, 47.97 (R) - 46.85 (D)
Montana: 5.75% winning margin, 50.25 (R) - 44.50 (D)
Biden Small-Margin Forecasted Wins
Georgia: 0.90% winning margin, 48.26 (D) - 47.36 (R)
Arizona: 1.76% winning margin, 48.22 (D) - 46.46 (R)
North Carolina: 2.06% winning margin, 48.87 (D) - 46.81 (R)
Florida: 2.39% winning margin, 49.14 (D) - 46.75 (R)
Pennsylvania: 5.52% winning margin, 50.56 (D) - 45.04 (R)
Nevada: 5.68% winning margin, 49.98 (D) - 44.30 (R)
This race is winnable for both candidates. However, my model’s forecast demonstrates that Biden’s path to victory is easier. If Biden holds all of the 2016 Clinton states, which he is forecasted to in my model, all he needs is to win Michigan, Wisconsin, and Pennsylvania. Only Pennsylvania is within 6%, with Biden forecasted to win by 5.52% and averaging 50.56% of the vote. Trump must win one of the three aforementioned Midwestern states in addition to holding all of his 2016 states, which may prove to be a challenge. The model forecasts Biden overtaking the Trump states of Georgia, Arizona, North Carolina, and Florida, but the margins are all within 2.5% and may be subject to a polling error. Furthermore, Trump may find winning Iowa, Ohio, and Texas difficult as well, as his forecasted win margin is within 1.15% in all of these states.
Part 3: Evaluating the Model and Making a Final PredictionIn Part 3, I evaluate my model and make my final prediction. I decided to test the 2016 polls against my model’s salient methodology: only including state-level polls that end on or after the day two weeks before election day, weighing all polls with a C- or below grade on FiveThirtyEight by 0%, weighing all other polls evenly, and determining the averages. I then compared the closest margins from the 2016 outcome to what my model predicts:
Michigan: Actual Margin: 0.23% Trump Model’s Margin: 3.07% Clinton
New Hampshire: Actual Margin: 0.37% Clinton Model’s Margin: 4.62% Clinton
Wisconsin: Actual Margin: 0.77% Trump Model’s Margin: 6.76% Clinton
Pennsylvania: Actual Margin: 0.72% Trump Model’s Margin: 3.38% Clinton
Florida: Actual Margin: 1.20% Trump Model’s Margin: 0.02% Clinton
Minnesota: Actual Margin: 1.52% Clinton Model’s Margin: 5.98% Clinton
Nevada: Actual Margin: 2.42 % Clinton Model’s Margin: 1.14% Clinton
Maine: Actual Margin: 2.96% Clinton Model’s Margin: 10.25% Clinton
North Carolina: Actual Margin: 3.66% Trump Model’s Margin: 1.00% Clinton
Arizona: Actual Margin: 3.54% Trump Model’s Margin: 1.97% Trump
So, the model would not have predicted President Trump’s victory in 2016. However, it is key to note that polling has changed since 2016. Pollsters have updated their methodologies to more accurately weigh polls by education and conduct more state-level polls [9]. Furthermore, the error between the actual margin and my model’s 2016 margin exceeds 6%, the aforementioned average error in the last three weeks of elections, in only 2 of the 10 closest states: Wisconsin and Maine. No model can be perfect. Good models, however, can give us a good perspective on the uncertainty of a race. Since the average error of polls in the final 21 days of all campaigns since 1998 is 5.9%, and in general elections, 4.0%, it is likely that the predictive interval for my last-two-weeks-polling model is around 4-6% as well [10].
This model forecasts 10 states to have margins within 6% in Tuesday’s election. This percentage is within my predictive interval, so I cannot definitively call the winner of the election. However, Joe Biden needs to win just 2 of these 10 states - Pennsylvania and Nevada - and he will likely win the election. If he falters in one of them, he can look to 4 other states he is leading in (FL, GA, AZ, NC) or 3 states he is within 1.2% of (TX, IA, OH). On the contrary, President Trump must win 8 of the 10 closest states and then win one of Pennsylvania (trailing by 5.52%), Nevada (trailing by 5.68%), or a non-Nevada Clinton 2016 state. President Trump is fighting an uphill battle as he did in 2016, but this cycle, the hill is much steeper. Consequently, I stick with my model and forecast that former Vice President Joe Biden will win the election with 350 electoral votes to President Donald Trump’s 188 electoral votes.
My final prediction is below. I used the model in each state I had data for. I marked the states I did not have data for as the way they voted in the 2016 election, as they are solid blue and solid red states. States forecasted within 5% are in light blue/red, states within 5-10% are in medium blue/red, and states that are not within 10% are filled in solid blue/red.
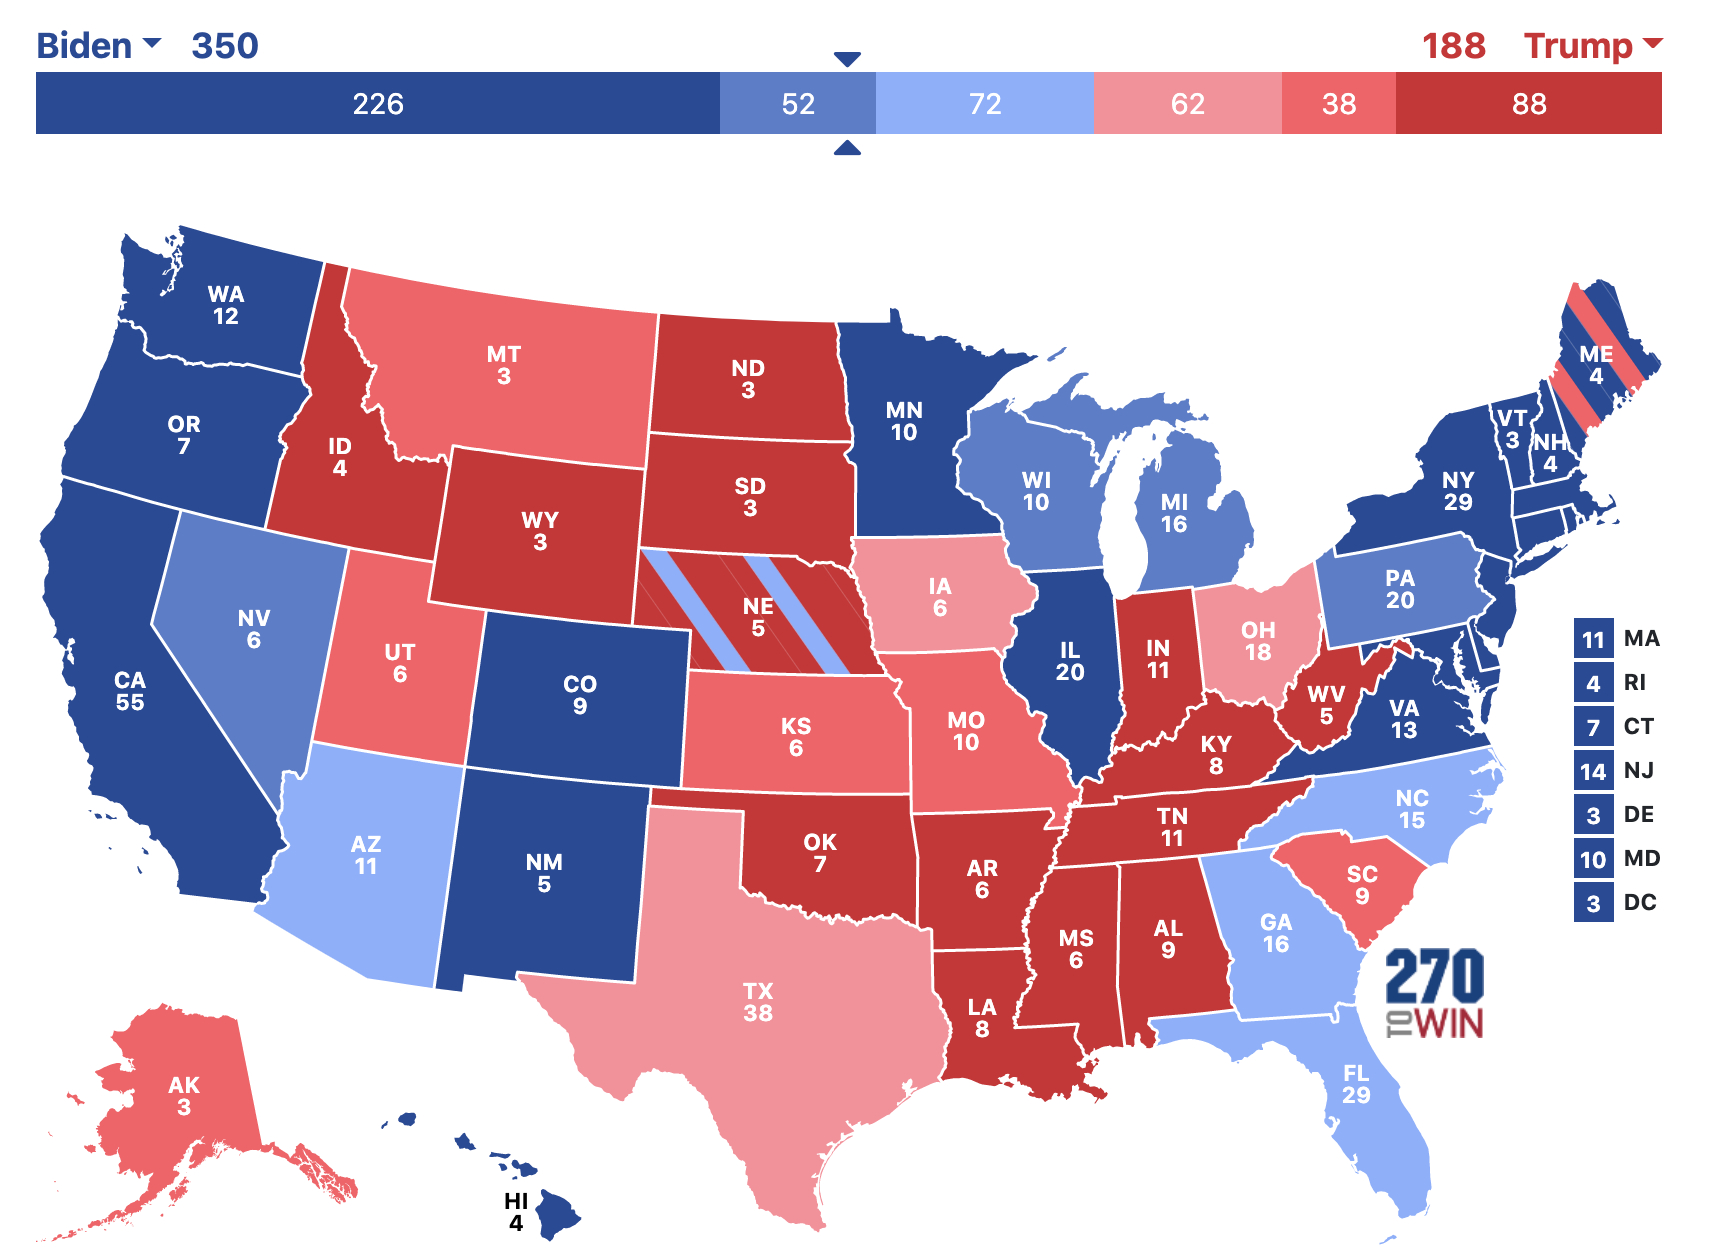
Final prediction: former Vice President Joe Biden will win the election with 350 electoral votes to President Donald Trump’s 188 electoral votes.
[1] https://www.cnbc.com/2020/07/30/us-gdp-q2-2020-first-reading.html
[2] https://projects.fivethirtyeight.com/2020-election-forecast/?cid=rrpromo
[3] https://www.bloomberg.com/graphics/2020-us-election-results/methodology
[4] https://github.com/fivethirtyeight/data/blob/master/polls/README.md
[5] https://fivethirtyeight.com/features/voters-really-did-switch-to-trump-at-the-last-minute/
[6] https://fivethirtyeight.com/features/how-fivethirtyeight-calculates-pollster-ratings/
[7] https://twitter.com/gelliottmorris/status/1296932556584169472?lang=en
[8] https://fivethirtyeight.com/features/the-polls-are-all-right/
[9] https://www.theatlantic.com/ideas/archive/2020/10/five-reasons-to-believe-2020-wont-be-a-2016-sequel/616896/
[10] https://fivethirtyeight.com/features/the-polls-are-all-right/