electionblog
Blog Post 10/17/2020: Can demographic changes help the Democrats win Texas?Throughout the 2020 election cycle many Democrats have said that former Vice President Joe Biden can win Texas in November, the latest being Beto O’Rourke, who tweeted on October 14th that “If Texans continue to smash voting records, Joe Biden will win Texas & the election will be over ON ELECTION NIGHT. No waiting days (weeks?) to count votes in Pennsylvania. If you want to destroy any chance Trump has to win or steal this election, then focus on Texas” [1]. A Democratic candidate has not won Texas since Jimmy Carter did in 1976, so a Biden Texas win, with its 38 electoral votes, would be a major event in the United States’ electoral system [2]. Thus, this week’s blog post is focused on whether demographic trend modeling can help predict if Texas goes blue this cycle.
Part 1: How the change in the number of white people in Texas influences Democratic two-party vote share.In Part 1, I analyzed how the change in the white makeup of Texas from the previous presidential election affects the Texas Democratic two-party vote share. I merged three datasets: one that includes the popular vote by state from 1948-2016, one that includes the polling average by state from 1968-2016, and one that displays state demographic data from 1990 to 2018. I filtered this joined dataset to include elections from 1992 onward, as those are the only presidential elections that I had individual state demographic data available for. Below is a graph of a linear model between the Democratic two-party vote share in Texas and the change in the white makeup of Texas from the previous election.
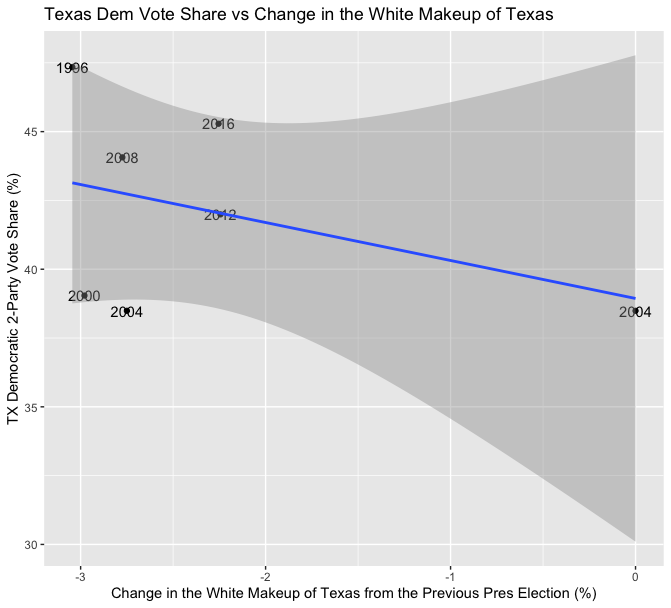
The line of best fit in this model had a y-intercept of 38.94% and a slope of -1.380. This slope means that for every 1% increase in white people in Texas, the Democratic two-party vote share decreased by 1.38%. It also means that every 1% decrease in white people is associated with a 1.38% increase in the Democratic two-party vote share. The multiple R-squared on this model was 0.1669, indicating that 16.69% of the data fits the regression model. Thus, this model is not very responsible for the variation in the Texan Democratic two-party vote share. However, the data visualization provides interesting insights into the status of the 2020 race. It is visible that as Texas gets more non-white, the higher the Democratic two-party vote-share gets. If Joe Biden wants to end the Republicans’ 10 election cycle streak in Texas, his campaign must focus on appealing to and motivating turnout among people of color.
Part 2: How the change in the number of women in Texas influences Democratic two-party vote share.In Part 2, I analyzed how the change in the women makeup of Texas from the previous presidential election affects the Texas Democratic two-party vote share. I used the same methodology as in Part 1 except my independent variable was the change in the women makeup of Texas.
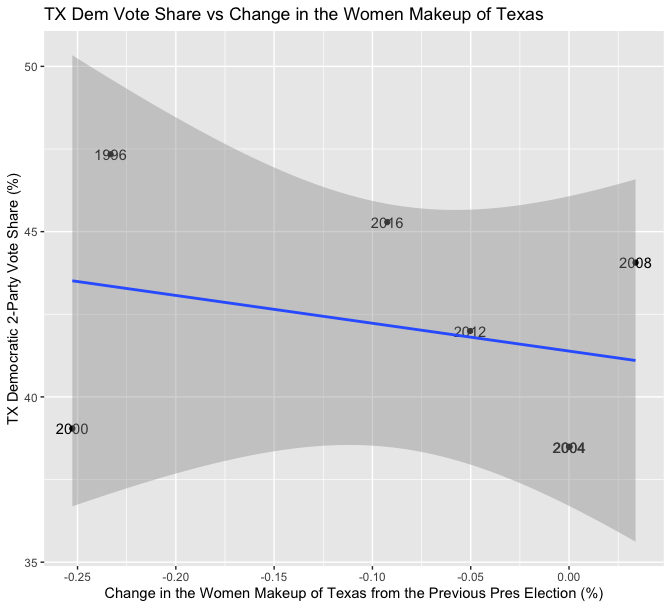
The line of best fit in this model had a y-intercept of 41.39% and a slope of -8.416. This slope means that for every 1% increase in women in Texas, the Democratic two-party vote share decreased by 8.416%. The multiple R-squared on this model was 0.07366, indicating that this model is not very responsible for the variation in the Texan Democratic two-party vote share. A more improved version of this model would use the change of women voters in Texas as the independent variable, not the change in the amount of women. I hope to gather this data and recreate this model next week. Since the men/women divide in Texas is based on biology, not politics, the demographic change percentage is nearly 0% for this category.
Part 3: How the change in the number of black people in Texas influences Democratic two-party vote share.In Part 3 of this week’s blog, I analyze how the change in the black makeup of Texas from the previous presidential election affects the Texas Democratic two-party vote share. Texas has been accused of voter suppression efforts for decades, even by Texas Monthly, which calls itself The National Magazine of Texas, and while this accusation may be political, writer Christopher Hooks points to its historically low turnout, most recently ranking 42nd in the nation in voter turnout in the 2018 midterms [3]. Consequently, I wanted to analyze how shifting black demographics affect Democratic vote share in Texas.
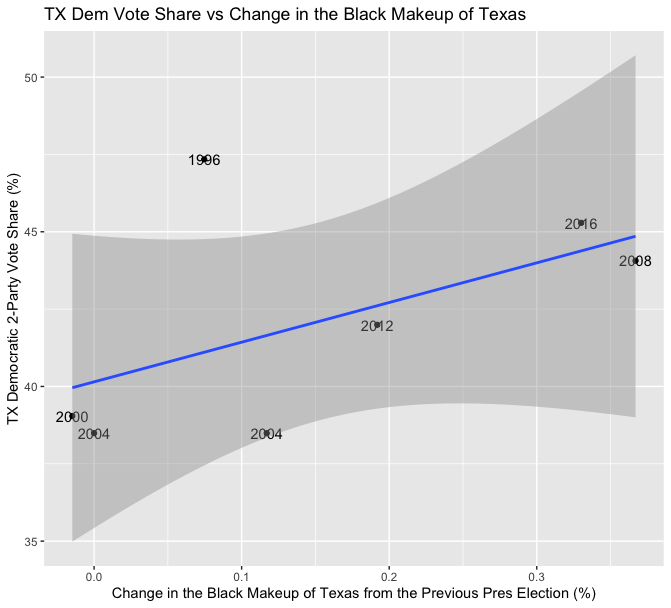
The line of best fit in this model had a y-intercept of 40.148% and a slope of 12.823. This slope means that for every 1% increase in black people in Texas over the previous election, the Democratic two-party vote share increased by an astonishing 12.823%. The multiple R-squared on this model was 0.2943, indicating that 29.43% of the data fits the regression model. It is not a perfect model, but it shows that the increasing number of black Texans bodes well for the future of the Texan Democratic Party. Biden, whose South Carolina primary win was famously propelled by black voters, would benefit from reaching out to black voters in Texas.
Conclusions and SourcesFor the final portion of this week’s analysis, I analyzed the change between Texas’ demographics in 2016 and 2018 to see how it would affect the Democratic two-party vote share in 2020. Since I do not have access to Texas’ 2020 demographics, I utilized my white-change model from Part 1, with a y-intercept of 38.94% and a slope of -1.380, and demographic data from 2018. To identify the change in demographics of white people in Texas, I subtracted the 46.09144 percentage of white people in 2016 from the 44.98931 percentage of white people in 2018, to receive a white change of -1.10213%. I then multiplied this number by the slope, -1.380, received 1.52094, and added it to the y-intercept of 38.94 to receive a Democractic two-party vote share of 40.46%. This model is likely innaccurate, as this 40.46% is significantly lower than the 45.29% Hillary Clinton received in 2016.
I then decided to use the model from Part 3, which had a higher multiple R-squared than the Part 1 model, and utilized the same methodology as above. I subtracted 12.14358% (from 2016) from 12.31405% (from 2018) to receive a 0.17047% change in the black demographic of Texas. I multiplied this by the slope of 12.823, received 2.18594, and added it to the y-intercept of 40.148 to get a Democratic two-party vote share of 42.33%. This is also significantly lower than Clinton’s two-party vote share in Texas in 2016.
FiveThirtEight forecasts a 48.0% vote share for Biden in Texas, which is significantly higher than my two predictions [4]. It is very likely that including fundamentals, polling, and demographics is preferred to my demographics change only models in this week’s blog posts. However, with both of my models predicting a Biden loss in Texas and FiveThirtyEight forecasting a 3.0% vote-share advantage for President Trump in the state, I predict a Biden Texas loss .
This week’s prediction: still a Biden win.
Thank you for reading! You can follow my election modeling journey by checking this blog each Saturday through December.
To complete this blog post, I utilized a popular vote by state from 1948-2016 dataset, a polling average by state from 1968-2016 dataset, and a state demographic data from 1990 to 2018 dataset from the Gov 1347: Election Analytics course website.
[1] https://twitter.com/BetoORourke/status/1316241328422948866?s=20
[2] https://www.sos.state.tx.us/elections/historical/presidential.shtml
[3] https://www.texasmonthly.com/politics/voter-suppression-texas-history/
[4] https://projects.fivethirtyeight.com/2020-election-forecast/