electionblog
Blog Post 10/3/2020: Incumbency Advantage and TrumpThis week, I will be investigating incumbency advantage in American presidential elections and considering how it will affect President Donald Trump’s re-election plan. There are a multitude of advantages for incumbent presidents, such name recognition, the ability to allocate federal funds to swing states, and an opportunity to start campaigning before the challenger, who may not receive his or her party’s nomination until a conventions. There are also disadvantages for incumbents, such as taking on the responsibility for the negative events occurred during the first term and not being a change candidate to those who wish to change the status quo. Thus, in this blog post, I will investigate how strong incumbency advantage is and what this means for the President’s re-election campaign.
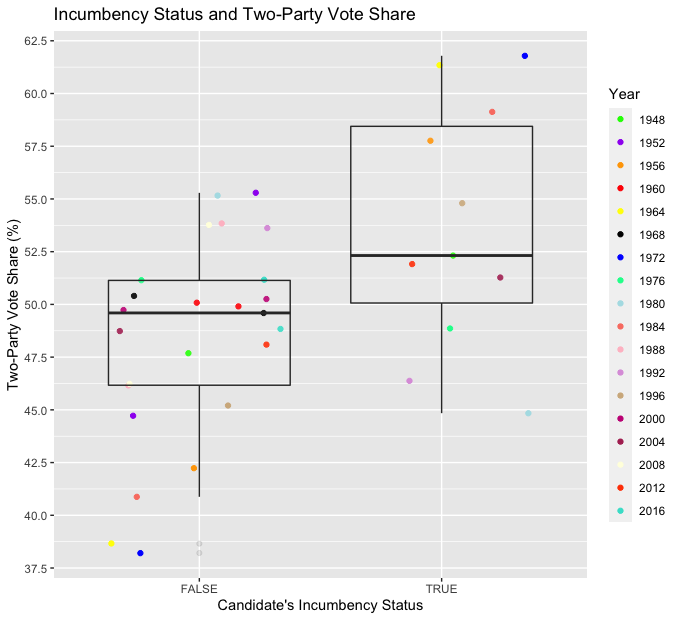
Part 1: Incumbent Candidate AdvantageFirst, I investigated incumbency advantage for incumbent candidates up for re-election. I gathered popular vote data on elections since 1948. In the elections since then, the median incumbent candidate received 52.31% of the two-party vote, while the median non-incumbent candidate received 49.60% of the two-party vote. Thus, one can infer that incumbent candidates have an incumbency advantage, not a disadvantage. Perhaps the most interesting further evidence for this claim is that the lower notch of the incumbents’ boxplot is higher than the median of non-incumbent candidates.
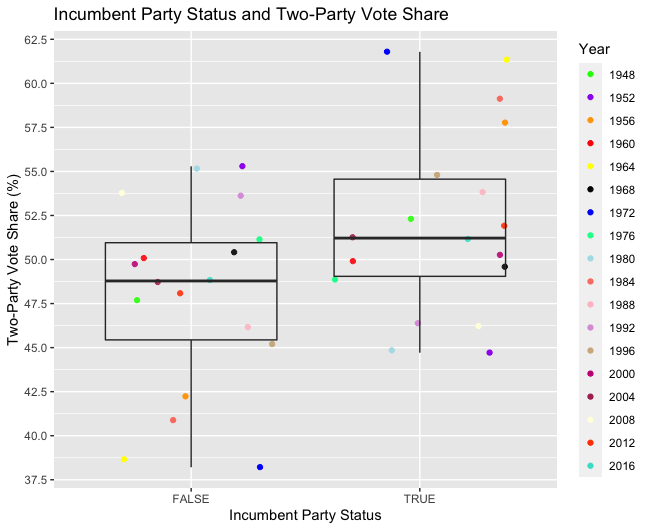
In part 2, I created a graph similar to the one in part 1, but the dependent variable was incumbent party status instead of incumbent candidate status. Thus, the TRUE dependent variable includes candidates who were not incumbents, but were part of the incumbent party, such as Hillary Clinton in 2016 after President Barack Obama’s two terms. In the elections since 1948, the median incumbent party candidate received 51.22% of the two-party vote, while the median non-incumbent party candidate received 48.78% of the two-party vote. These medians differ from the incumbent candidate status medians by less than 1.1% and may not be significant. Nevertheless, the evidence of incumbency advantage is undeniable.
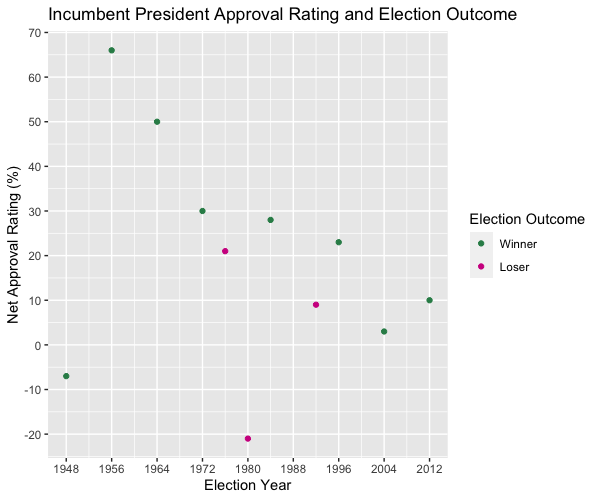
In part 3, I investigated how approval rating among incumbent candidates affects election outcomes. I filtered my dataset to include only incumbent candidates facing re-election since 1948. I then plotted their approval rating the year of the election and colored the data points based on whether they won or lost re-election. It is very notable that 8 incumbent candidates won re-election and only 3 lost. However, it is just as notable that every incumbent that won re-election in this time period had a positive net approval rating except for Harry Truman in 1948. This is worrisome for President Trump’s re-election hopes, as his net approval rating is currently -7.6 [1].
In conclusion, incumbency advantage is certainly strong. However, President Trump faces an uphill battle, as his negative net approval rating may outweight the advantages of incumbency. Furthermore, his handling of the coronavirus pandemic in terms of public health and the economy may cause his incumbency to be a disadvantage, not an advantage.
This week’s prediction: Biden win.
Thank you for reading! You can follow my election modeling journey by checking this blog each Saturday through December.
To complete this blog post, I utilized a popular vote 1948-2016 dataset from the Gov 1347: Election Analytics course website.
[1] https://projects.fivethirtyeight.com/trump-approval-ratings/