electionblog
Blog Post 9/19/2020Connecticut, my home state, has voted for the Democratic nominee for President each year since 1992 with at least 54% of the two-party vote share. In this week’s edition of my blog posts, I investigate how Connecticut’s unemployment affects Democratic and Republican two-party vote shares during Presidential election years. This allows me to gauge how local economic performance affects Connecticut’s electoral behavior. As Connecticut is often deemed a safe blue state, I predict that higher unemployment raises the GOP vote share and decreases the Democratic vote share due to voter desire to change the status quo.
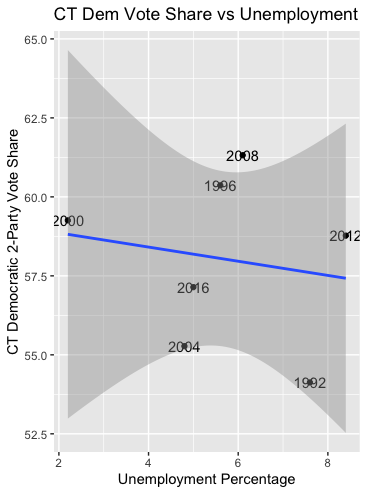
Part 1: Democratic Vote Share ModelFirst, I wanted to investigate how the unemployment percentage affects the Democratic two-party vote share. I thus created a graph that demonstrates the relationship between the Democratic two-party vote share and the unemployment percentage since 1992. I included a line of best fit, with a y-intercept of 59.31% and slope of -0.2242. A slope of -0.2242 means that for every 1% increase in the unemployment rate, the Democratic two-party vote share decreases by 0.22%. This is in line with my theory that increasing unemployment in a blue state like Connecticut will decrease Democratic vote share. However, the multiple R-squared on thihs model was just 0.02951, meaning that the unemployment percentage is not very responsible for the variability among the Democratic vote shares.
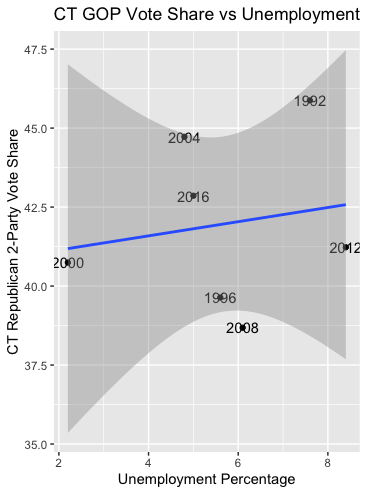
I then created a model for how the Connecticut unemployment rate affects the Republican vote share. I created a graph, below, of the Connecticut GOP vote share versus the unemployment rate. It is evident that the line of best fit in this graph has a positive slope, indicating that an increase in unemployment in Connecticut leads to higher Republican vote share in presidential elections. The y-intercept of the line of best fit was 40.69% and the slope was 0.2242. The multiple R-Squared was 0.02951 again, indicating the limitations of the CT unemployment percentage in predicting the variability of CT GOP vote share. Using the leave-one-out method of model testing, the predicted GOP vote share for 2016 was 41.6%, a bit off from the actual 42.85% Donald Trump received.
In conclusion, these visualizations support my theory that increasing unemployment in Connecticut signals good things for the GOP’s CT vote share and bad things for the Democratic CT vote share in presidential election years. However, leave-one-out model testing and low multiple R-squared numbers indicate that Connecticut unemployment is not very responsible for the variation of the vote share.
When I attempted to test the models with recent CT unemployment data for the 2020 election, my model showed very large increases in the predicted GOP vote share. This is due to the inverse relationship my models create; as unemployment goes up, GOP vote share goes up. This is not a relationship that can be scaled nationally. As such, I plan to stay away from using solely state unemployment data in my future predictions. A model based on local unemployment would have to use more variables to be more predictable than mine.
To complete this blog post, I utilized popular vote by state data from 1948-2016 and local economy data from 1976-present from the Gov 1347: Election Analytics course website.
Thank you for reading! You can follow my election modeling journey by checking this blog each Saturday through December.